Use this as a quick reference for the kinematic equations, free fall, and how slopes and areas on motion graphs connect to velocity and acceleration.
🧭 Plot Summary
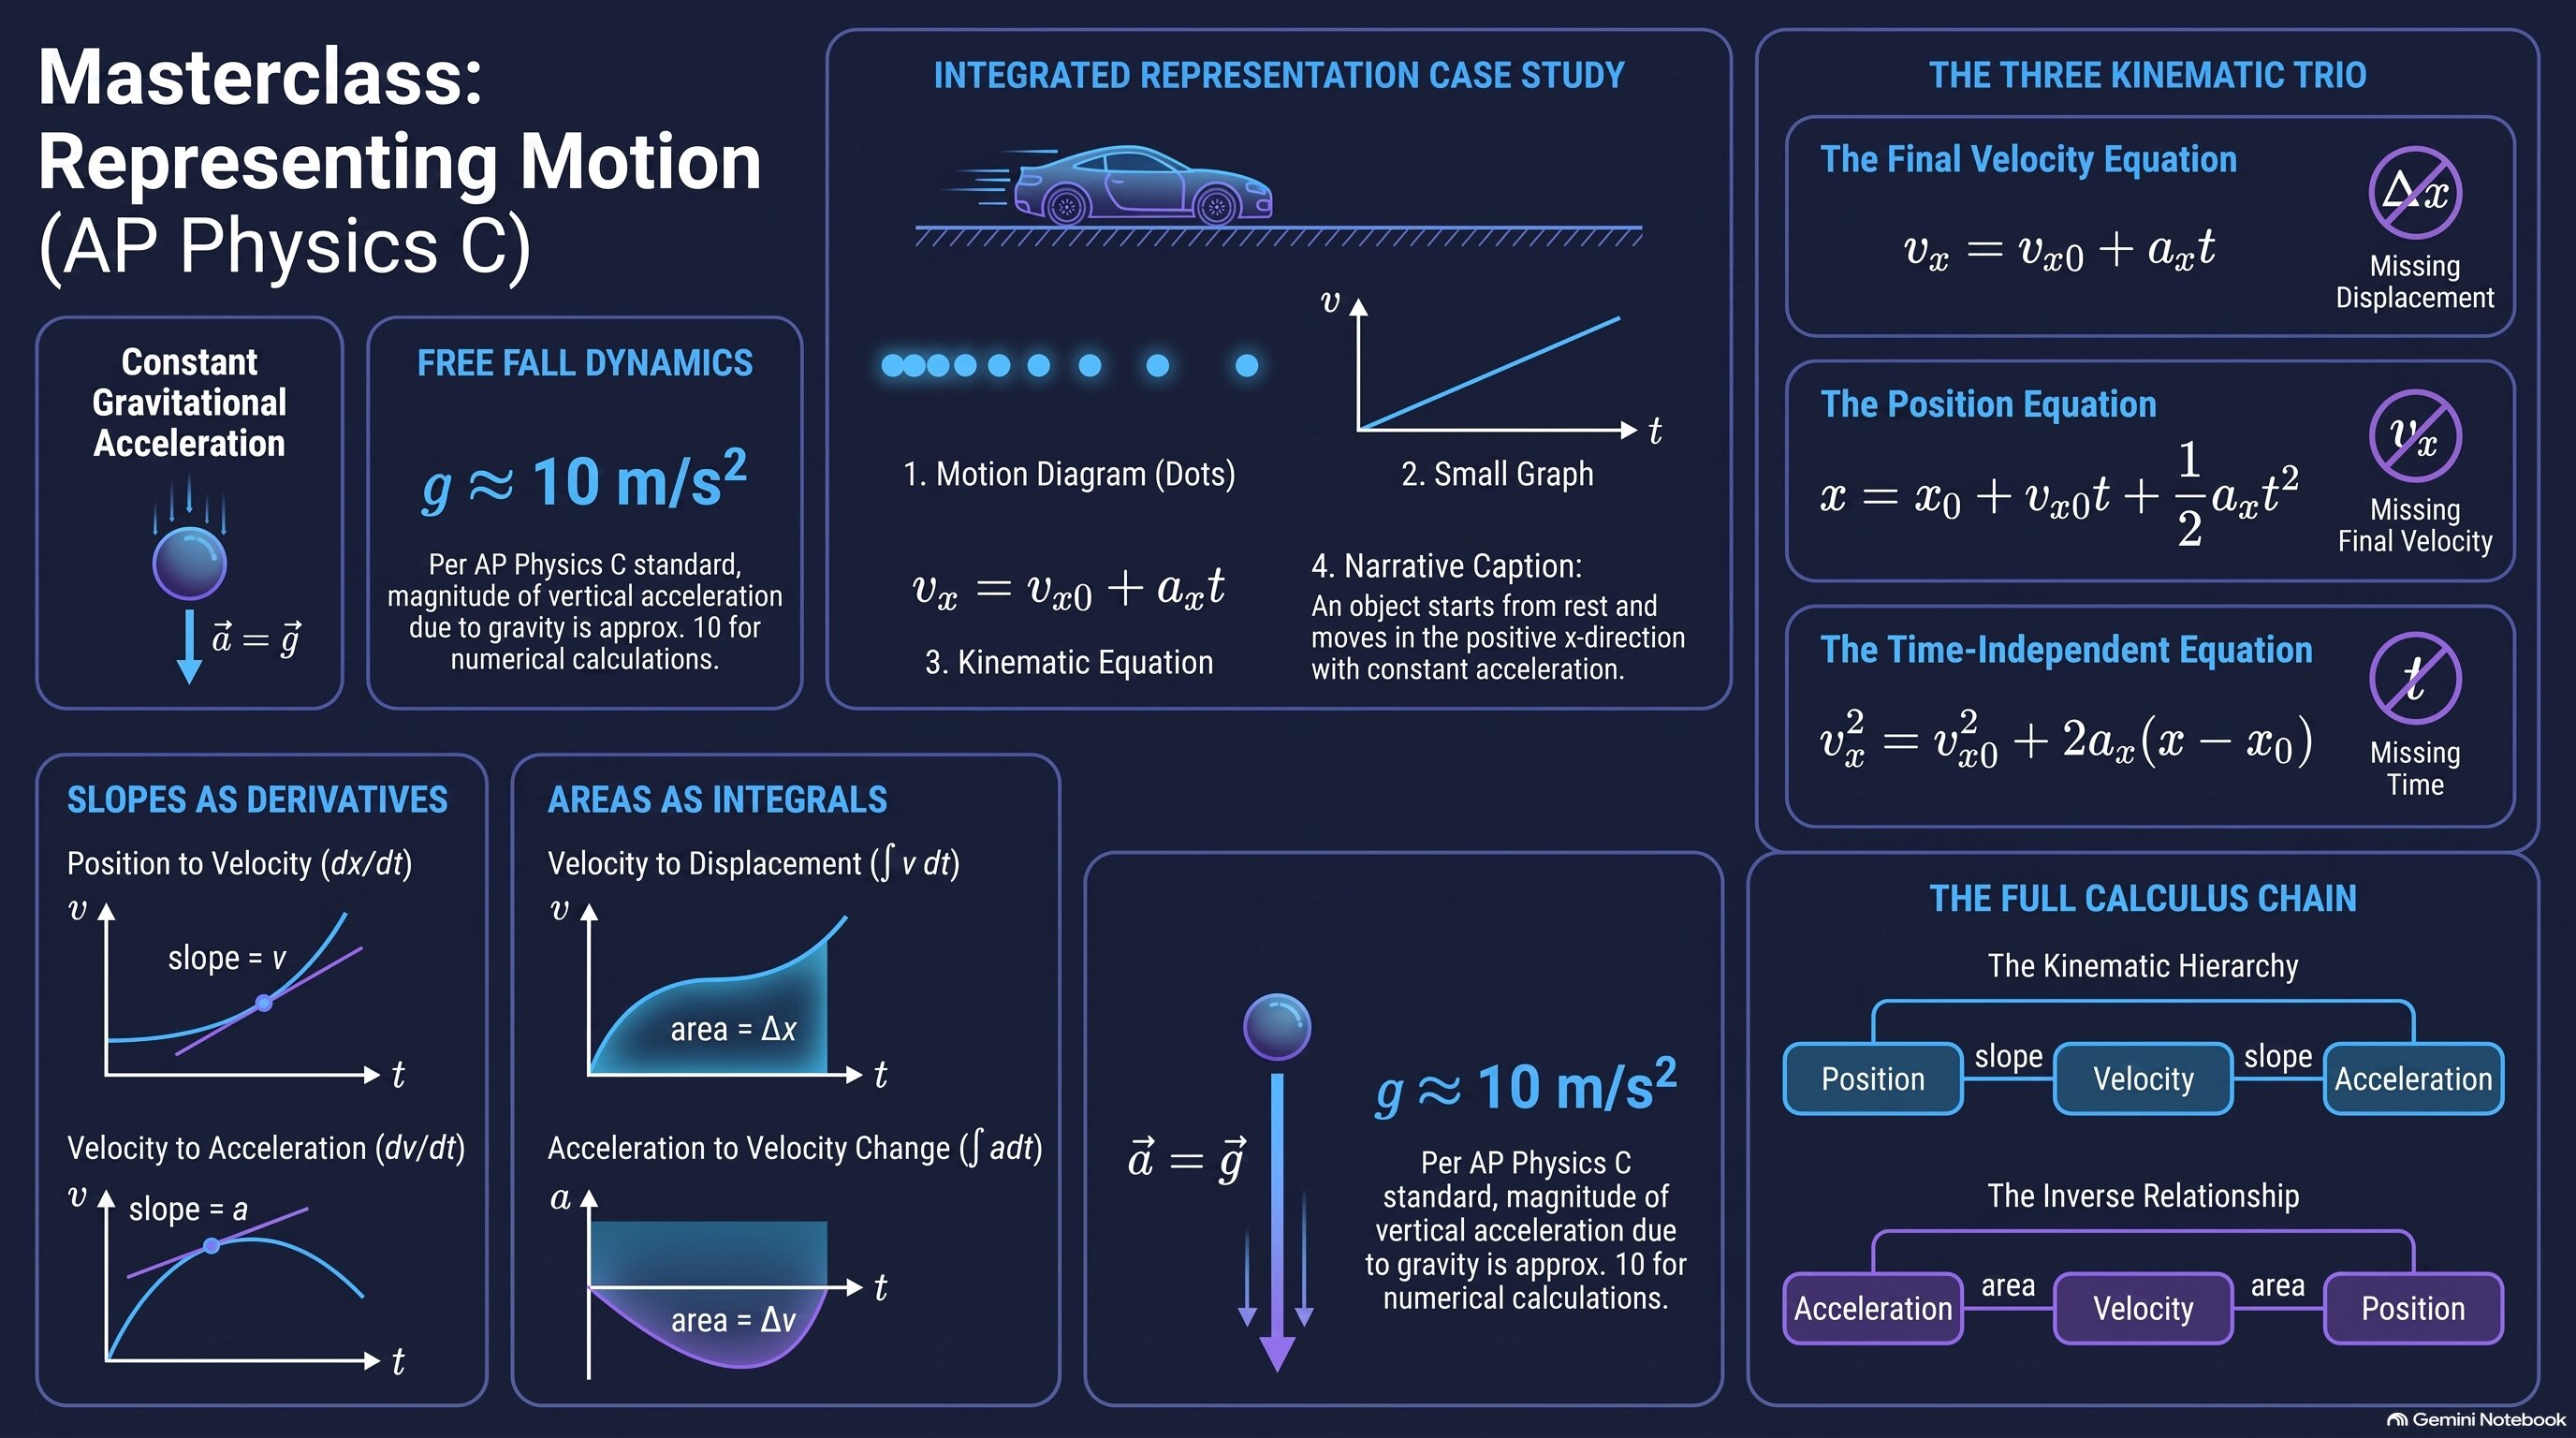
Motion can be told five different ways — as a diagram, a graph, an equation, a narrative, or a calculus expression — and this lesson is about learning to move fluently between all of them. First come the three constant-acceleration kinematic equations, the algebraic workhorses you'll use whenever acceleration doesn't change, including the special case of free fall near Earth's surface. Then the lesson turns to graphs: the slope of a position-time graph is velocity, the slope of a velocity-time graph is acceleration, and — running the logic in reverse — the area under a velocity-time graph is displacement, and the area under an acceleration-time graph is the change in velocity.
What you'll do in this lesson
- Recognize the same motion expressed as a diagram, a graph, an equation, and a narrative description.
- Apply the three constant-acceleration kinematic equations to find position, velocity, time, or acceleration.
- Use g ≈ 10 m/s² for objects in free fall near Earth's surface.
- Read instantaneous velocity as the slope of a tangent line on a position-time graph.
- Read instantaneous acceleration as the slope of a tangent line on a velocity-time graph.
- Read displacement as the area under a velocity-time graph.
- Read the change in velocity as the area under an acceleration-time graph.
Why it matters
This lesson is the payoff for everything you learned about derivatives in 1.2. Once you can read slopes and areas on a graph the way you read an equation, you stop needing to be handed a position function — you can pull the same information straight out of a graph, which is exactly how most AP free-response questions present motion.
✅ Self-Check Before You Roll On
Check off each item as you get there. These aren't grades — they're your own signal.