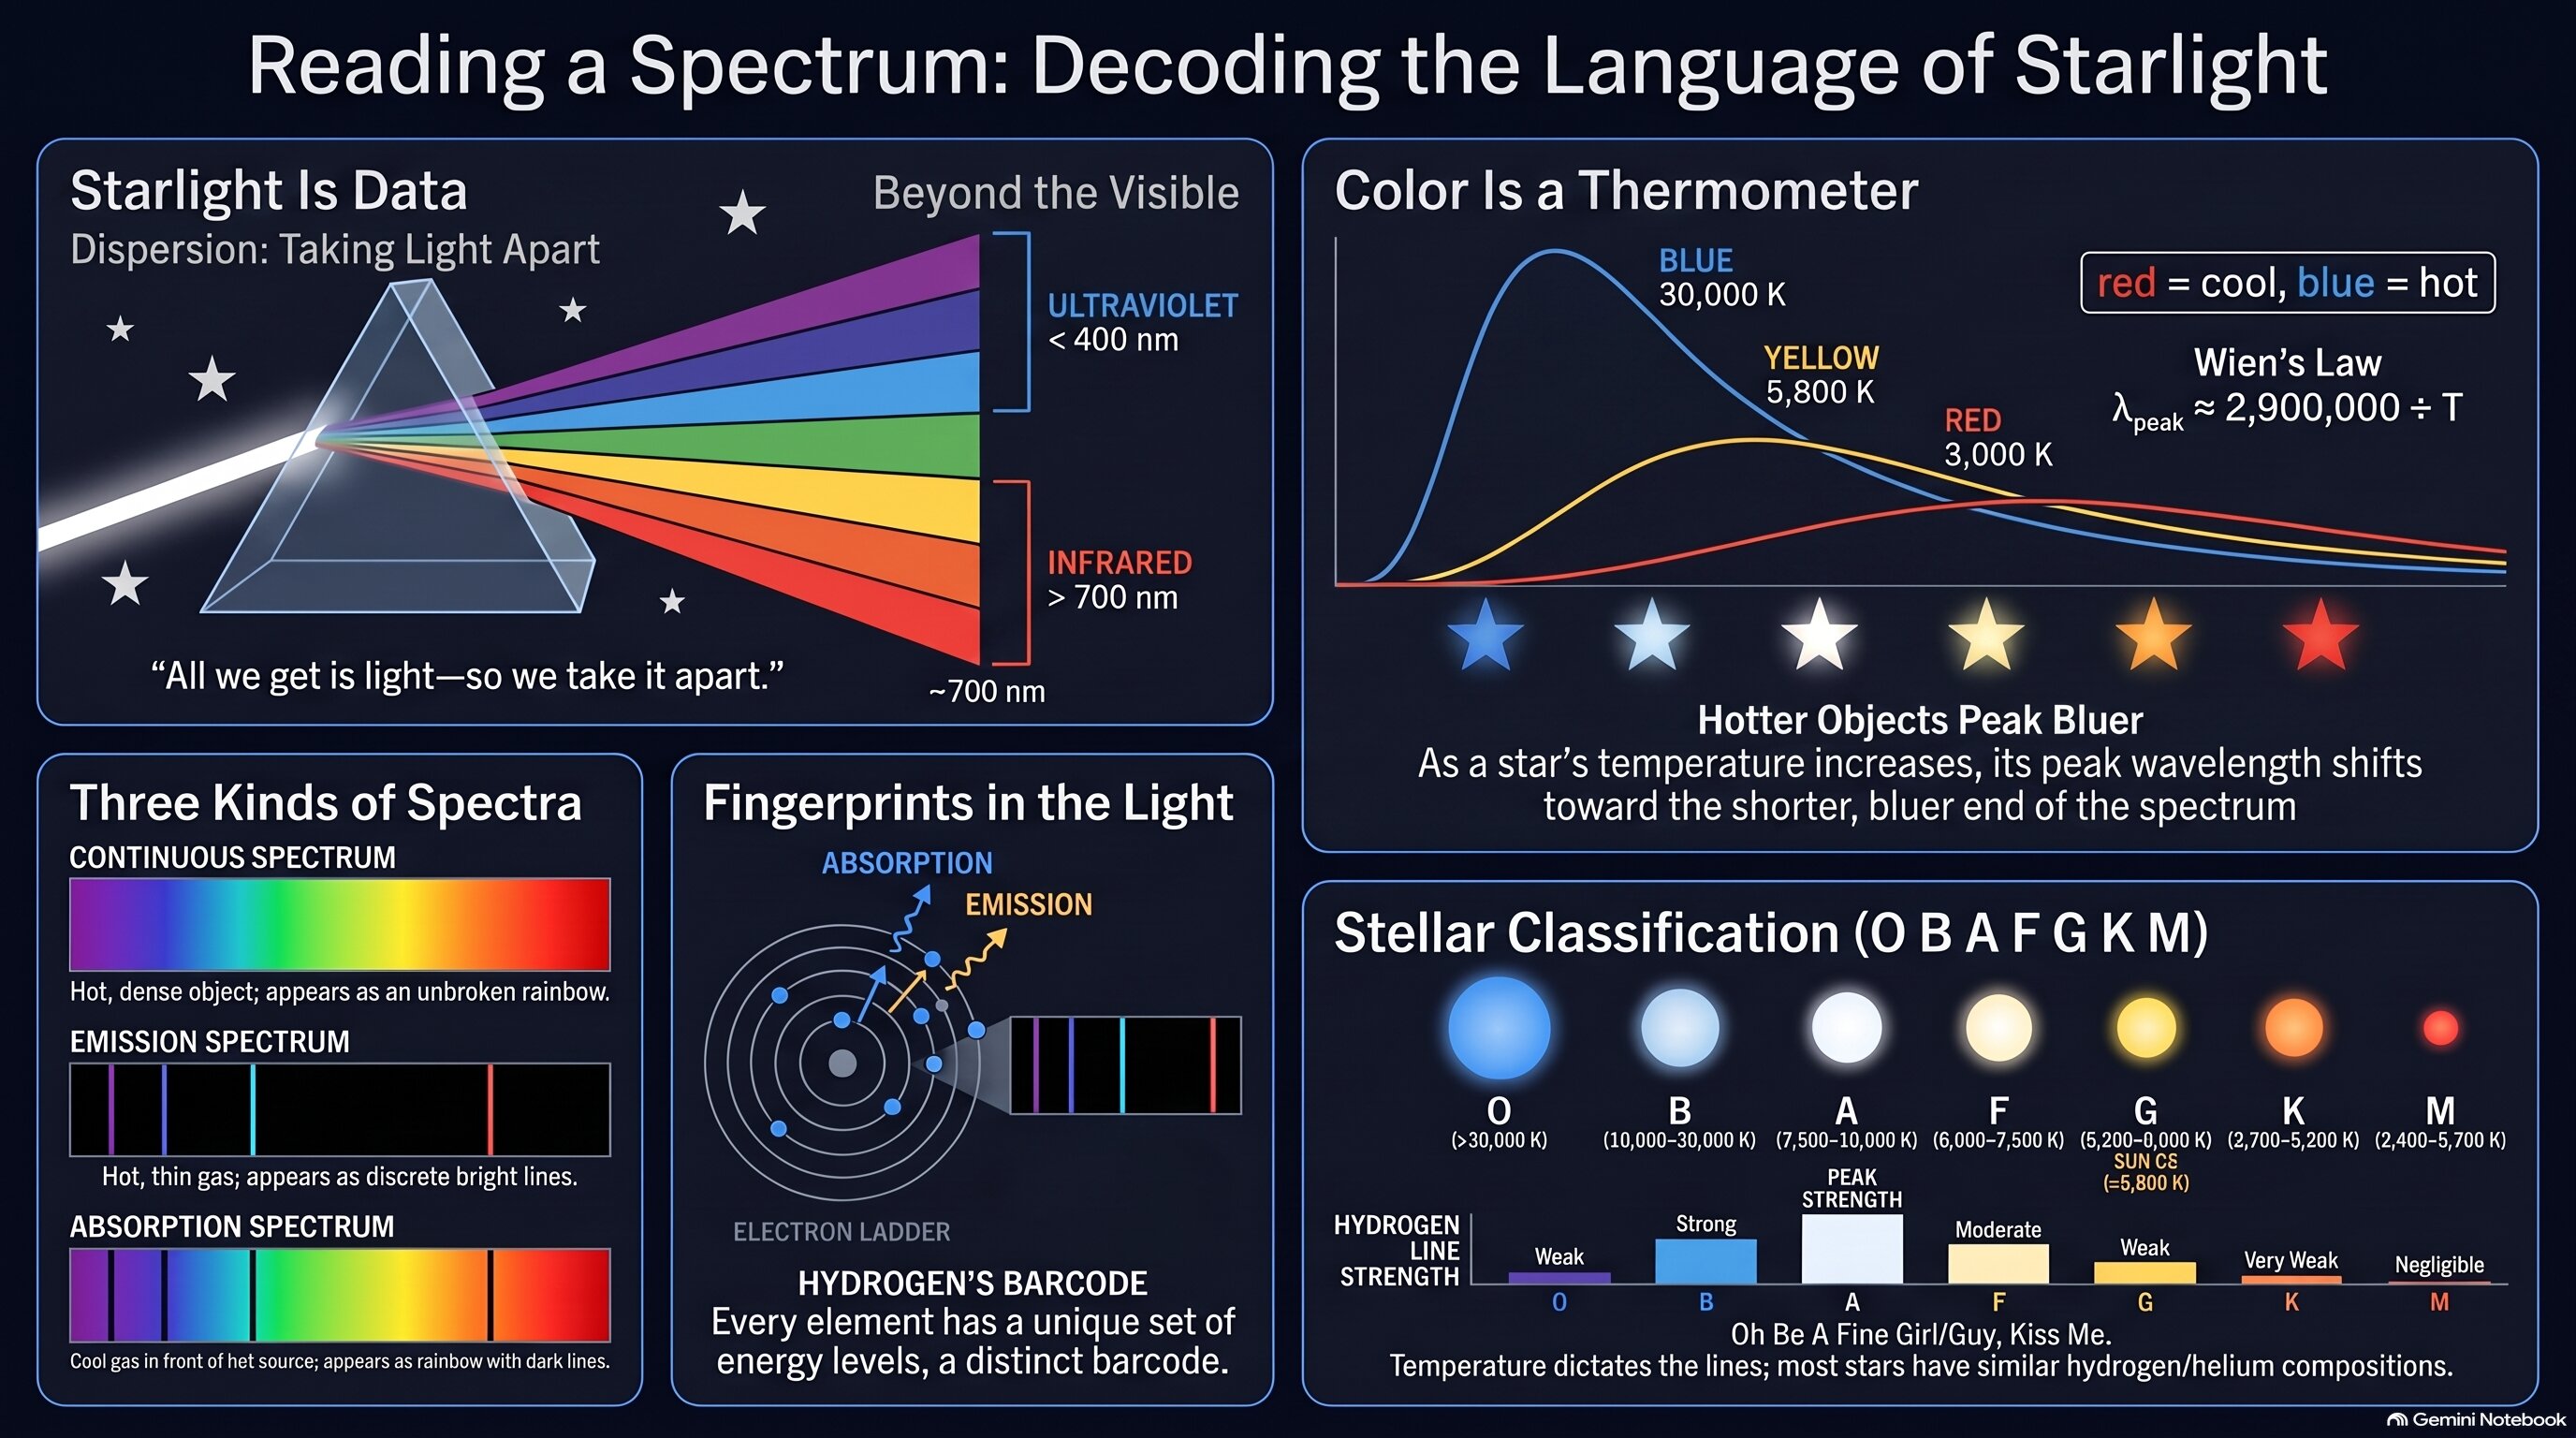
Quick reference for color and temperature, the three kinds of spectra, and the spectral classes.
🌈 Plot Summary
Nobody has ever visited a star, dipped a thermometer into one, or scooped up a sample. Everything we know about the stars comes from their light. Spread that light out into a spectrum and it turns into a data sheet: the overall color tells you how hot the star's surface is, and the thin dark absorption lines crossing the rainbow are the fingerprints of the atoms in its atmosphere. Astronomers use those two clues together to sort every star into a spectral class — O, B, A, F, G, K, or M — a single letter that packs a star's temperature into one label.
What you'll do in this activity
- Spread starlight into a rainbow, and find out why that rainbow is almost everything we'll ever know about a star.
- Use a star's color as a thermometer — and learn why "red hot" isn't anywhere close to as hot as it gets.
- Read the dark lines crossing a spectrum like a barcode, matching them to the elements that made them.
- Sort stars into the seven spectral classes, O through M — the same system astronomers have used for over a century.
- Catch the plot twist: most stars are made of nearly the same stuff. The lines change because the temperature does.
Why it matters
Project 4.1.3, Stellar ID Cards, asks you to classify real stars by spectral type — and Problem 4.3.1, What Happens to This One?, hands you a star's raw spectrum with no name attached. This is where you learn to read it.
✅ Self-Check Before You Roll On
Check off each item as you get there. These aren't grades — they're your own signal.